The Department of Public Health (DPH) Division of HIV
and STD Programs (DHSP) utilizes mapping to inform
distribution of resources for HIV and sexually
transmitted disease (STD) prevention and treatment in
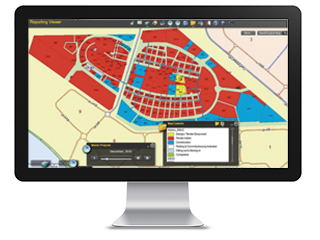
Los Angeles County. Geographic Information Systems (GIS)
is a computer system designed to capture, store,
manipulate, analyze, manage, and present spatial or
geographic data. DHSP has been using this important tool
since 2004 to develop maps to identify geographic areas with higher HIV and STD burden
facilitating improved distribution of scarce resources
to the communities and people most in need. Data for the
GIS is captured from various sources including DHSP's
HIV Surveillance data, STD Surveillance data, HIV
Testing Services data, HIV Care Services Utilization
data, and the Los Angeles Coordinated HIV Needs Assessment (LACHNA).
The maps created from the captured data in GIS is used
in conjunction with other data sources to not only aid
in resource distribution, but also to evaluate the
effectiveness of HIV and STD prevention and care
services county-wide.
- For archived maps, please visit our Archived
Maps page.
- For L.A. County's zip code level data/maps on
HIV, please visit AIDSVu.org.
DHSP Mapping Project - 2010-2014 HIV & STD
Burden by Health District
 The latest mapping endeavor, 2010-2014 HIV & STD
Burden by Health District, ranks geographical areas in order of highest to lowest
HIV and STD burden throughout LAC to more efficiently
distribute resources to communities in most need.
Geographic areas (health districts) are ranked by
several important driving factors for the geographic
burden of HIV and STDs: number
of infections, number of people infected, the population
size, geographic size, and results from the hot spot
analyses*.
The latest mapping endeavor, 2010-2014 HIV & STD
Burden by Health District, ranks geographical areas in order of highest to lowest
HIV and STD burden throughout LAC to more efficiently
distribute resources to communities in most need.
Geographic areas (health districts) are ranked by
several important driving factors for the geographic
burden of HIV and STDs: number
of infections, number of people infected, the population
size, geographic size, and results from the hot spot
analyses*.
The 2010-2014 HIV & STD Burden by Health District
plays a critical role in informing and updating DHSP's
continuing efforts to reduce new HIV and STD incidents
and account for all reported cases of HIV and STDs in
the City of Long Beach, City of Pasadena, and throughout
LAC. Its primary purpose is to support geographic
prioritization of DHSP resources by
updating and building upon the GIS syndemic cluster maps
produced by DHSP in 2009. Additionally, the new mapping
strategy shares regularly collected HIV and
STD surveillance data in a way that highlights the
interrelationships between HIV, syphilis, gonorrhea and chlamydia. Rather than looking at each disease in isolation, the mapping of HIV
and STD Burden
by Health District allows for each HIV/STD to be viewed
in the context of a person's other diseases and from
several other vantage points, including:
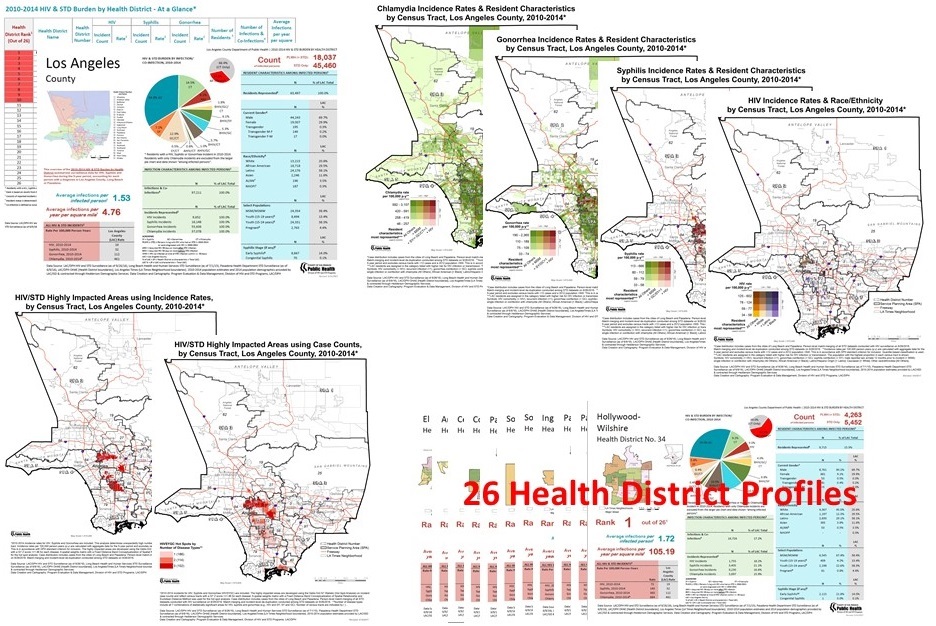
1. Aggregated to health districts for detail on HIV and STD infected populations (i.e., health district profiles);
2. Aggregated to census tracts for LAC disease-specific maps showing the differences of disease spread relative to risk fo HIV infection or transmission (i.e., bivariate maps); and
3. Aggregated to census tracts and analyzed using hot spot analysis to map where we have unexpectedly higher numbers of incidents (i.e., HIV/STD Highly Impacted Areas maps).
By building upon the 2009 syndemic cluster mapping and
by sharing data in these various ways, DHSP and agencies
critical to reducing new HIV and STD infections will
have the information needed to create truly synergistic
prevention and treatment programs for both HIV and STDs.
For more details regarding DHSP's health district
mapping project, please click the arrow to expand.
▼
Demographic sub-groups and disease characteristics (e.g., co-infections, recurrent infections,
stage of syphilis) data helpful for targeted programs are detailed in the health district profiles.
This is the first time DHSP has compiled HIV, syphilis, gonorrhea and chlamydia incidents for all of
LAC to produce data that allows us to see each person’s history of HIV/STDs. Each health district profile
provides a comprehensive snapshot of the HIV and STD burden, with the intention of producing data that alone
or in combination with other surrounding health districts support efforts by planning agencies, funders, and
agencies seeking funding that align with DHSP's role of preventing and reducing HIV and STDs in LAC. Several
LAC supporting maps guided production of the health district profiles. The bivariate maps for each disease
demonstrate the spread of the disease burden relative to the risk for HIV infection or transmission, while the
hot spot analyses visualized in the HIV/STD Highly Impacted Areas maps show census tracts considered to have unexpectedly high numbers of incidents.
Many of the limitations and challenges encountered in the 2009 syndemic cluster mapping are addressed in the 2010-2014 HIV & STD Burden by Health District.
Challenges to the 2009 cluster mapping included the following:
- Difficulty translating data to community and providers into a service delivery format.
- Service providers looked at the clusters and questioned the boundaries.
- Translating the magnitude of burden between clusters.
- Data could not be matched. Person-level infections could not be determined.
- Cluster maps were missing portions of Los Angeles County (LAC) (i.e., Cities of Long Beach and Pasadena, which have their own health departments).
This update adds to what we currently know and addresses the above challenges by:
- Use of 5 years of data, which averages spikes from any given year.
- Use of recognizable boundaries (i.e., health districts), which are subdivisions of service planning areas (SPAs)
and aggregated census tracts, to retrieve population-level data.
- Overlaid LA Times Neighborhoods boundaries to provide geographic context.
- Incorporation of matched data which allows for reporting of person-level sociodemographics, behaviors and infections;co-infections and recurrent infections.
*Number of infections is defined as total number of infections in a health district, accounting for co-infections (i.e., HIV, syphilis, gonorrhea, chlamydia).
Number of people infected is defined as total number of people in a health district who have one or more HIV, syphilis, gonorrhea or high risk chlamydia incidents.
A high risk chlamydia incident is defined as a person with a chlamydia incident and a diagnosed HIV infection as of 08/29/2016 or a co-infection with syphilis or gonorrhea.
Population size is defined as total number of people living in a health district.
Geographic size is defined as the size of the geographic area of a health district by square miles.
Hot spot analysis is a statistical analysis method that determines census tracts considered to have unexpectedly high numbers of incidents.
At a
Glance
The At
a Glance for the 2010-2014 HIV & STD Burden by Health
District assembles select data from all health district
profiles into a table for easier comparison.
.jpg)
Guide to the Health District Profiles
The Guide to the Health District
Profiles summarizes the methods used to produce the data
and how to interpret each of the data points. For more information on Health District Profiles please click
here.
.jpg)
Suggested Citation: Division of HIV and STD Programs, Los Angeles County Department of Public Health.
2010-2014 HIV & STD Burden by Health District.
http://publichealth.lacounty.gov/dhsp/Mapping.htm.
Published May 2017. Accessed [date]